

You are here
Indicator 7 - Preschool Outcomes
Definition
Percent of preschool children aged 3 through 5 with IEPs who demonstrate improvement in the following areas:
- Indicator 7A. Positive social-emotional skills (including social relationships).
- Indicator 7B. Acquisition and use of knowledge and skills (including early language/ communication and early literacy).
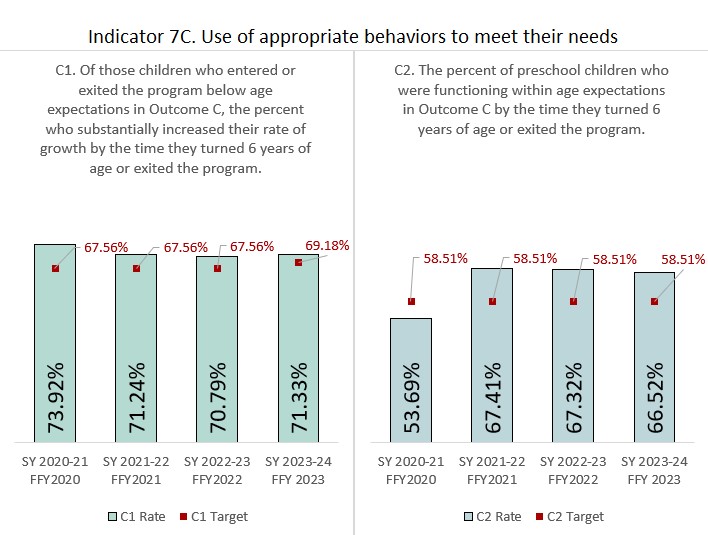
- Indicator 7C. Use of appropriate behaviors to meet their needs.
(20 U.S.C. 1416 (a)(3)(A))
Measurement
The state must report on 3 outcomes:
A. Positive social-emotional skills (including social relationships);
B. Acquisition and use of knowledge and skills (including early language/communication and early literacy); and
C. Use of appropriate behaviors to meet their needs.
For each outcome, the state must report the percent of children who qualify for the following two summary statements:
Summary Statement 1: Of those preschool children who entered the preschool program below age expectations in each Outcome, the percent who substantially increased their rate of growth by the time they turned 6 years of age or exited the program.
Summary Statement 2: The percent of preschool children who were functioning within age expectations in each Outcome by the time they turned 6 years of age or exited the program.
How is Colorado doing on this indicator?


State Level
Administrative Unit Level
- Local Report of Summary Statement Data, 2023-2024 (Excel)
- Local Report of Summary Statement Data, 2022-2023 (Excel)
- Local Report of Summary Statement Data, 2021-2022 (Excel)
Targets for the Current SPP/APR Cycle
| Federal Fiscal Year (FFY) | 2020 | 2021 | 2022 | 2023 | 2024 | 2025 |
|---|---|---|---|---|---|---|
| Data from School Year | 2020-21 | 2021-22 | 2022-23 | 2023-24 | 2024-25 | 2025-26 |
| Target A1 >= | 75.32% | 75.32% | 75.32% | 75.32% | 75.32% | 76.81% |
| Target A2 >= | 63.25% | 63.25% | 63.25% | 63.25% | 63.25% | 64.92% |
| Target B1 >= | 78.87% | 78.87% | 78.87% | 78.87% | 78.87% | 80.28% |
| Target B2 >= | 66.95% | 66.95% | 66.95% | 66.95% | 66.95% | 68.58% |
| Target C1 >= | 67.56% | 67.56% | 67.56% | 69.18% | 70.80% | 72.42% |
| Target C2 >= | 58.51% | 58.51% | 58.51% | 58.51% | 58.51% | 60.22% |
Improvement Strategies
- CDE currently provides AUs with the Administrative Data Use Self-Assessment, an online resource, to monitor their own data use.
- CDE will develop a structured TA plan that includes the implementation of an evidence-based data-based decision-making and problem-solving process at the local level by using these critical questions: (SY2021-22)
- Accountability questions are the focus of the TA plan.
- What is the quality of the EC program where young children receive special education services? (inclusive practices and a standards-aligned curriculum are the outcomes that we expect)
- How do outcomes for children differ between service-delivery models (structures) and child outcomes?
- What do families report help their child develop and learn?
- CDE and the LEA will identify detailed roles and expectations in building a culture of data use.
- CDE will develop and provide a process flow for data analysis.
- CDE will provide data visualizations and training on data literacy
- Accountability questions are the focus of the TA plan.
- CDE is planning on providing individualized TA support to AUs in the implementation of collaborative planning and data-based decision-making. (SY2022-23)
- CDE is planning on identifying Promising Practices on data use and publishing them on the website. (SY2023-24)
Additional Resources
The feedback period has closed, this video is included for information on the target setting process.
For more information, contact:
Having trouble with this webpage?

If you have problems with broken links or accessing the content on this page, please contact the Exceptional Student Services Unit at ESSU@cde.state.co.us. Please copy the URL link for this page into the email when referencing the problem you are experiencing.
Financial information on schools and districts throughout Colorado. Learn more about financial transparency.
Colorado Dept. of Education
201 East Colfax Ave.
Denver, CO 80203
Phone: 303-866-6600
Contact CDE
CDE Hours
Mon to Fri, 8 a.m. to 5 p.m.
See also Licensing Hours
UPDATED
December 19, 2024
Copyright © 1999-2025 Colorado Department of Education.
All rights reserved.
Title IX.
Accessibility.
Disclaimer.
Privacy.

Connect With Us


