

You are here
Colorado Public School Finance
TOTAL PROGRAM FUNDING
Colorado public schools receive money from a variety of sources. However, most revenues to Colorado's 178 school districts are provided through the Public School Finance Act of 1994.
The total amount each school district receives under the School Finance Act is referred to as “total program,” which includes both the state share and local share. The local share is generated through property taxes and specific ownership taxes (vehicle ownership taxes).
Total program funding equals:
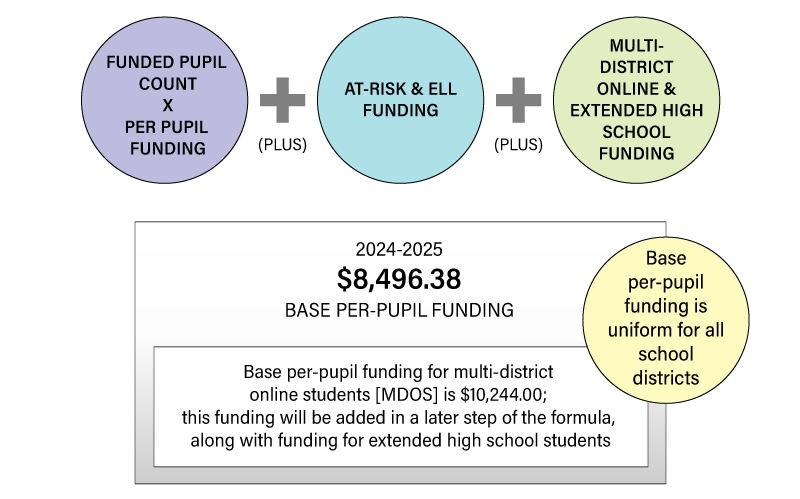
BASE PER PUPIL FUNDING AND FACTORS
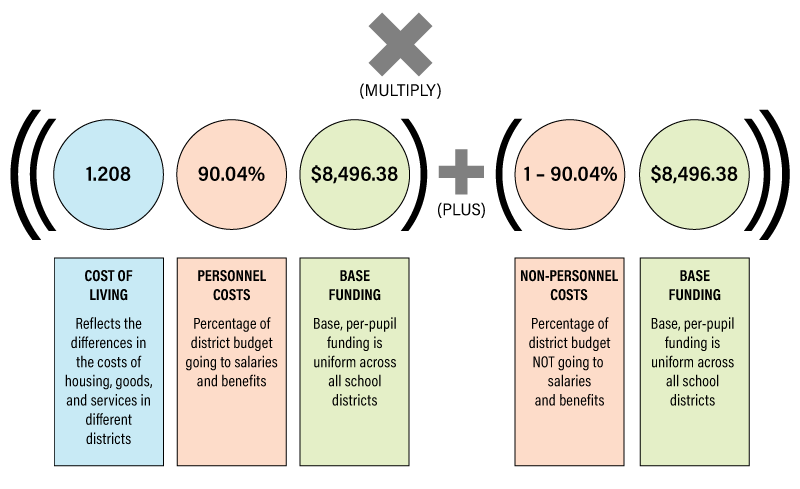
Here are the factors that adjust base per pupil funding:
- Cost of living: Determined by a legislative study every two years. Districts with higher costs of living have a higher factor. For example, Aspen has a higher cost of living factor than Center.
- Personnel costs: Personnel costs vary by school district based on enrollment. For all districts, employee salaries and benefits represent the largest single expense. As such, the formula directs funding based on application of the above cost of living factor to estimated personnel costs.
- Size of district: Similar to the personnel costs, the size factor is unique to each district and is determined using enrollment. Small districts have larger size factors than districts with higher enrollment.
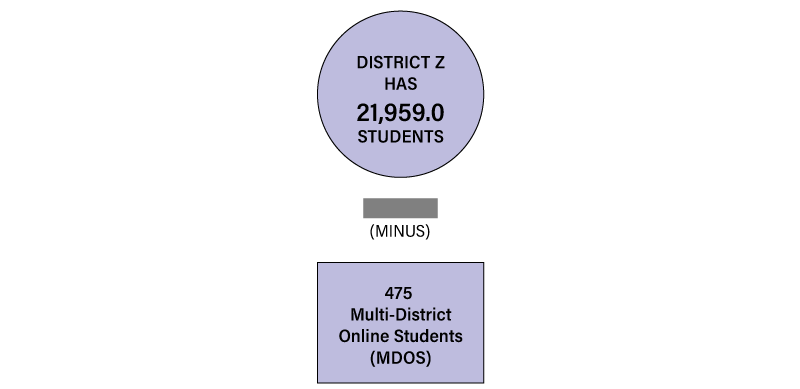
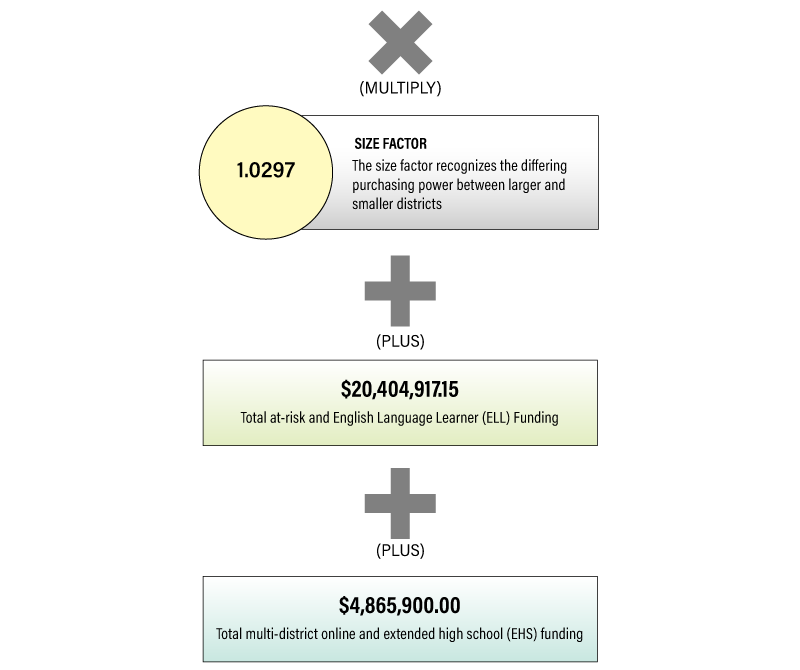
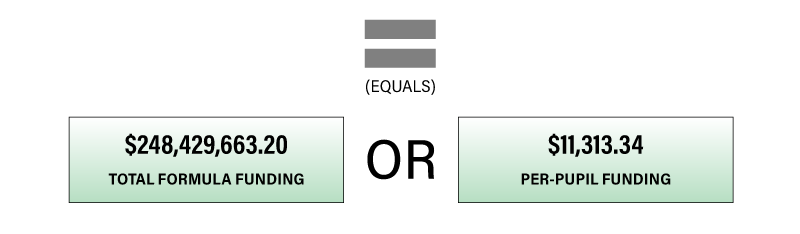
DISTRICT EXAMPLE: TOTAL PROGRAM FUNDING
Below is an example of how the total program is calculated based on their final appropriation. There are many additional calculations. Each district has different calculations based on individual demographics and characteristics.
Each element of the formula has its own formula behind it. For example, the size factor is determined by a formula for each district. The at-risk funding has its own formula, etc.
Financial information on schools and districts throughout Colorado. Learn more about financial transparency.
Colorado Dept. of Education
201 East Colfax Ave.
Denver, CO 80203
Phone: 303-866-6600
Contact CDE
CDE Hours
Mon to Fri, 8 a.m. to 5 p.m.
See also Licensing Hours
UPDATED
May 7, 2025
Copyright © 1999-2025 Colorado Department of Education.
All rights reserved.
Title IX.
Accessibility.
Disclaimer.
Privacy.

Connect With Us


